
Price Problems
April 12, 2024 -- After some less-than-stellar inflation reports in January and February, investors were hoping that the more favorable trend for price pressures would return for March. Unfortunately, this wasn't the case, and put to rest the argument that the increase in inflation to start the year was the result of what was termed to be "residual seasonality" effects.
While there has been no massive or sudden reversal of the downtrend for inflation, there has been a change in direction, at least for prices as measured by the Consumer Price Index. For March, the overall CPI posted a rise of 0.4%; this figure was above expectations for the third straight month, and lifted the overall annual rate of CPI to 3.5%, a six-month high. Rising energy costs drove the top-line figure higher, and oil prices have been on the rise again lately. However, even the core measure (where energy and food prices have been stripped from the calculation) came in on the high side again, also posting a 0.4% increase for a third consecutive month. In this trimmed measure, goods prices declined by 0.2%, but service costs continued to run warm, sporting a 0.5% increase. Although the latest bump in prices didn't change the annual core CPI rate from 2.8%, the recent string of firm readings will make it more difficult for that annual rate to decrease much in the coming months.
Of course, if inflation isn't moving in the direction the Fed hopes and the market expects, it does diminish the prospects for rate cuts this spring.
Prices in the economy's producer level actually didn't increase as much as was expected, but failed to impart much by way of confidence about inflation as a whole. The Producer Price Index for March sported just a 0.2% increase, a bit tamer than was expected and a nice step down from February's outsized 0.6% increase. Goods inflation settled back, declining by 0.1% for the month but service costs continued to perk along with a 0.3% increase, so the annual rate for overall PPI moved up to a 2.1% pace. While this rate is still tame, it was just 0.8% as recently as November, so the trend here is headed in the wrong direction. Goods inflation moved up to a annual 0.9% rate (up from -1.6% at the turn of 2024) while service costs for producers are running at a 2.8% annual clip, the fastest pace since last July.

In general, service costs tend to be more 'sticky" than are goods prices, making it harder for inflation to decline.
Broadly speaking, the U.S. is a net importer of goods and a net exporter of services. Prices for goods imported into the U.S. in March carried price tags that were 0.4% higher than those in February. This monthly increase was enough to lift the annual rate of import inflation to 0.4%; while this is a level of little concern, it was the highest increase in import costs since January 2023 and part of an uptrend that started after a -2.4% clip was achieved just four months ago. The U.S. has also started exporting a little more inflation lately too; export prices rose by 0.3% for March, eroding more of the recent annual decline in export costs, now just one of -1.4% compared to a year ago. As with the CPI and PPI, there has been a shift in the wrong direction in import and export prices, and these changes in trend might engender additional price pressures in the months ahead.
Late last week, futures markets were assigning roughly an 80% probability that the first cut in rates by the Fed would come in June. After the CPI report on Wednesday, that dropped to roughly 20%, but has edged up to about 27% as we write this on Friday -- and a July move is only being given about a 55% chance. In order to reflate hopes for a near-term cut in rates, we'll likely need to see back-to-back improvements for inflation (and perhaps more) -- or the Fed's preferred measure for prices (core PCE inflation) will need to diverge more from these more common markers of inflation than they have been. Annual core PCE has been running a full percentage point below annual core CPI over the last few months.
Want to get MarketTrends as soon as it's published on Friday? Get it via email -- subscribe here!
As you might expect, the less comforting news regarding inflation caused a considerable rise in market-based interest rates. This week, the influential yield on the 10-Year Treasury note has returned to levels last seen in November, a time when mortgage rates were just coming off their peaks and optimism regarding rate cuts for 2024 were taking hold. That's no longer the case; mortgage rates have firmed recently and are poised to go higher still.
|
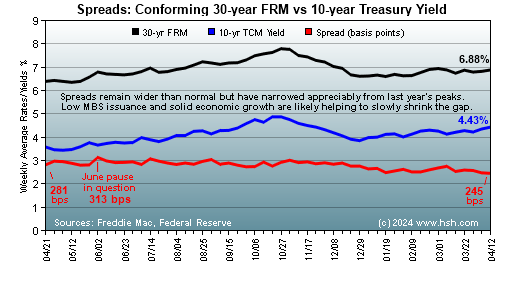
While that's bad news for potential homebuyers, the reality is that things could actually be worse. Over the last few months, the differential between the yield on the 10-year Treasury and the average rate for conforming 30-year fixed-rate mortgages has narrowed appreciably compared to where it was at times last year. In turn, this means the sizable increase in Treasury yields over the last few weeks won't lift mortgage rates as high as similar selloffs did at those times. Although it doesn't change the fact that rates are high and heading higher, it's at least a relative victory for borrowers.
Find these only at HSH.com!
Minutes of the March Federal Reserve meeting were released this week, and provided little new insight or color as to the outlook for policy. The minutes did contain a lot of initial discussion about how the Fed expects to change the process of running off its massive holdings of bonds, sometimes called "Quantitative Tightening" (QT). As we wrote in our post-Fed meeting analysis, we expected that all of the change to runoff would come from the Treasury side of the Fed's holdings. The minutes largely bore this out: "With redemptions of agency debt and agency mortgage-backed securities (MBS) expected to continue to run well below the current monthly cap, participants saw little need to adjust this cap, which also would be consistent with the Committee's intention to hold primarily Treasury securities in the longer run. Accordingly, participants generally preferred to maintain the existing cap on agency MBS and adjust the redemption cap on U.S. Treasury securities to slow the pace of balance sheet runoff."
The minutes also largely confirmed what we've believed for some time in that the Fed does not actually know what size its balance sheet needs to be or eventually will be. "Although they saw the current level of reserves as abundant, participants emphasized the underlying uncertainty about the level of reserves consistent with operating in an ample-reserves regime. They noted various price and quantity metrics that they saw as important real-time indicators of conditions in short-term funding markets that could provide signals that reserves are approaching a level somewhat above ample." Presumably, once "abundant" reserves become only "ample", QT for Treasuries will come to a close, but mortgage runoff may continue. At some point the Fed may need to sell MBS and other mortgage holdings outright in order to get to a place where they hold only Treasuries.
A strong spurt of sales more than offset an increase in holdings at wholesaling firms in February. Overall inventory levels at for these middlemen expanded by 0.5%, with durable goods stockpiles rising by 1% and non-durables shrinking by 0.3% for February. Overall sales rose by 2.3% for the month, rebounding smartly after a 1.4% decline to start the year. More goods headed out the door than accumulating on stockroom shelves meant that the February inventory-to-sales ratio thinned out to just 1.34 months of supply on hand, leaning out inventories to where they were last October. This appears to have fostered some additional orders to manufacturers, something reflected in the March ISM data we reviewed last week.
Just a touch dimmed, Consumer Sentiment was mostly level to start April, according to the University of Michigan Survey of Consumers. Their barometer of moods settled back by 1.5 points from where it closed March, sliding to a 77.9 value to start the month. Current conditions were assessed to be somewhat less favorable and posted a 3.2-point decline to 79.3, while expectations for future economic conditions edged just 0.4 lower to a flat 77 in the initial April review. The survey did reveal that inflation concerns have kicked a bit higher of late (likely due to higher gasoline and certain food costs). As polled here, consumers' one-year outlook for inflation was moved up to 3.1% (from 2.9% at the end of March) and the five-year expectation for inflation lifted to back to 3% (from 2.8%). Although these price outlooks are very much in line with where they have been recently, the one-year outlook is back up to its highest point since December and the five-year back to November, so clearly some enthusiasm about the direction for inflation has waned of late.
The economy remains solid, running at an estimated 2.4% annual rate in the first quarter, and there appears to be little change in the labor market to be seen. Initial claims for unemployment assistance totaled 211,000 in the week ending April 6, continuing a very flat trend at a low level that has held for months now. It may be that an upturn in claims and a corresponding uptick in the unemployment rate may be needed to get inflation to the Fed's goal, but there's little indication that either of those are coming anytime soon.
See today's mortgage rates every day at HSH.com
Does mortgage history repeat? Usually. Find out what happened last week/month/year with MarketTrends archives!
Applications for mortgage credit managed a 0.1% increase in the week ending April 5, according to the Mortgage Bankers Association. Requests for funds to purchase homes sank by 4.7%, so the spring homebuying season continues its fairly cold pace. However, applications to refinance existing mortgages actually leapt 9.9% higher, and this despite less favorable mortgage rates in the market. Perhaps some homeowners looking to do cash-out refinances have come to the realization that lower mortgage rates aren't coming very soon, and waiting for them risks delaying plans for things like home renovations, and so jumped into the market.
We'll start getting a more detailed look at the start of the spring housing market next week, when updates from the National Association of Home Builders comes, followed by the March report on housing construction and permits for future projects. Later in the week, we'll also see the March update for sales of existing homes. Given the typical time lag between the time a contract to purchase is signed and when the closing takes place, the March report will be reflective of buyer demand in late January and much of February, when mortgage rates were again firming up. At least according to the National Association of Realtors Pending Home Sales Index for February, a modest improvement in March sales should be expected; however, there's no way to know how much of the 1.6% increase in sales agreements From February made it all the way through to closing in March , so the actual sales number for March may be fairly flat.
Current Adjustable Rate Mortgage (ARM) Indexes
| Index | For The Week Ending | Year Ago | |
|---|---|---|---|
| Apr 05 | Mar 08 | Apr 07 | |
| 6-Mo. TCM | 5.34% | 5.35% | 4.88% |
| 1-Yr. TCM | 5.04% | 4.94% | 4.53% |
| 3-Yr. TCM | 4.50% | 4.31% | 3.64% |
| 10-Yr. TCM | 4.35% | 4.13% | 3.35% |
| Federal Cost of Funds |
3.889% | 3.876% | 3.139% |
| 30-day SOFR (daily value) | 5.32901% | 5.31864% | 4.59322% |
| Moving Treasury Average (MTA/12-MAT) |
5.114% | 5.088% | 3.744% |
| Freddie Mac 30-yr FRM |
6.82% | 6.74% | 6.27% |
| Historical ARM Index Data | |||
In the last little while, we spent some time considering homebuying conditions this spring and wrote a discussion piece titled "What's holding back housing?". Yes, mortgage rates are high, but they've been here before, so the issues facing potential homebuyers goes beyond this impediment. Some are relatively recent, some have been with us already for years, and others have their genesis in the housing crash and Great Recession. Have a read and see what you think.
One thing is certain in that the mortgage rate situation isn't going to get any better next week. The selloff in Treasuries and bonds that began more than a week ago didn't lift mortgage rates as much as we expected this week, but if anything the rise in yields intensified somewhat this week. Mortgage rates cannot resist this pressure indefinitely even if spreads over Treasuries are thinning. Concerns about new attacks in the middle east saw a rush to safety on Friday, reversing this week's run-up in yields a little on Friday. That said, with the 10-year Treasury yield ending the week at about 4.5%, it's hard not to expect the average offered rate for a conforming 30-year FRM to land close to 7% next week, not that a 12 basis point increase from this week's platform is all that much of a leap.
What's the outlook for mortgage rates for much of the spring homebuying season? See what we think when you take look at our latest Two-Month Forecast for mortgage rates, covering April into early June.
To start each year, we release our Annual Mortgage and Housing Market Outlook. In it, we take a forward look at a range of topics, including mortgage rates, Fed policy, home sales, home prices and lots more; come July, we do an interim review of our expectations. Have a look and see if you think we're off or on point with our long-range forecast.
For a really long-run outlook, you'll want to check out "Federal Reserve Policy and Mortgage Rate Cycles".
Have you seen HSH in the news lately?
Want to comment on this Market Trends? -- send your feedback, argue with us, or just tell us what you think.
See what's happening at HSH.com -- get the latest news, advice and more! Follow us on Twitter.
For further Information, inquiries, or comment: Keith T. Gumbinger, Vice President
Copyright 2024, HSH® Associates, Financial Publishers. All rights reserved.