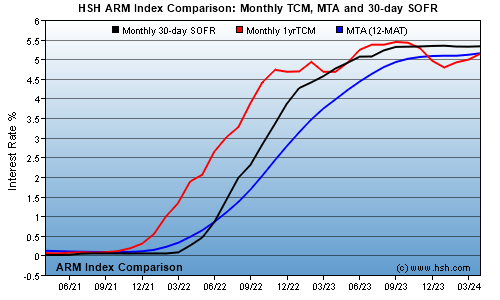
Comparison: One-Year TCM vs. SOFR vs. MTA (aka 12-MAT)
The graph below compares monthly values of the One-Year US Treasury Constant Maturity against an HSH-calculated monthly value for 30-day SOFR (Secured Overnight Financing Rate) and the 12-month Moving Treasury Average (MTA). All are popular indices for changing interest rates on many kinds of Adjustable Rate Mortgages; SOFR has replaced LIBOR as the new benchmark for Fannie Mae and Freddie Mac eligible loans, while the 1-year TCM and MTA are still popular legacy indexes, especially among smaller banks and credit unions.
We've been asked over the years which ARM index is "best". To be honest, there is no such thing; these financial indicators move up and down with changes in the economy and in monetary policy. By regulation, a lender can have no control or influence over how an index moves up or down.
Like all ARMs, whether you do better or worse is a bit of a gamble, depending upon when your ARM comes due to adjust, the lender markup ("margin") over the index value and any caps which limit the rate change from period to period.
ARM indexes usually fall into two camps: Those that "lead", or move in anticipation of changing conditions and those that "lag", moving after conditions have changed. Many legacy ARMs use the weekly value of the one-year Treasury Constant Maturity; Treasurys are considered leading indicators, as they often begin moving up or down before economic or monetary policy events occur. For convenience of comparison, we display the monthly average of the one-year TCM in the graph.
The MTA -- an average of the previous twelve values of the monthly Treasury -- smooths out the spiky nature of the 'raw' Treasury value. However, because it looks back over a long period, it can take a long time to realize increases in rates which have already occurred. When rates are rising, there's some benefit to a slower moving index, but less immediate benefit when rates are falling. Even if underlying interest rates stopped rising right now, the MTA would continue its climb for a year or more from today.
SOFR -- the Secured Overnight Financing Rate -- is a new indicator, coming into existence just a few years ago. The most commonly used value for mortgages is a 30-day average SOFR; because it looks backward over the last 30 days of daily values, it too is a lagging index, but the lag is a fairly short time period. SOFR is also directly impacted by what the Fed does with interest rates, and so may move up or down in fairly large steps as changes in monetary policy occur.
|
While the lender doesn't have control over the index value, they do have some say in the margin added onto that value, which in turn becomes your loan's newly-adjusted rate. If a loan is to be sold to Fannie Mae or Freddie Mac, those entities dictate the size of the add-on. For SOFR-based ARMs, the maximum margin a lender can use is 300 basis points (three percentage points), so that's what most lenders will utilize. Margins for Treasury-based ARMs are typically 275 basis points (2.75%), while ARMs tied to the MTA frequently have margins of 250 basis points (2.5%).
Of course, if a lender is putting your loan on his books and isn't going to sell it to anyone, they have direct control over the margin they will charge. Since most ARMs aren't sold to the GSEs, it may be possible for you to locate two lenders offering ARMs with identical initial rate offers and caps and other features, but one may have a smaller margin. A loan with a smaller margin will always costs less over time, so make sure you ask about margins if you're shopping for an ARM.
At times, there can be considerable differences between the value of one index compared to another, but these generally balance over time. For example, the average difference between the leading one-year Treasury and SOFR was more than 50 basis points (0.50%) as the Treasury was increasing in anticipation of a string of Fed moves, but settled to just 10 basis points (0.10%) after those moves occurred. With Treasury yields rising quickly in expectation of more Fed hikes, the difference between the leading Treasury and lagging SOFR got as wide as about 1.8% -- only to diminish to just 11 basis points as SOFR increased while the treasury declined.
SOFR's gap to the MTA averaged only about nine basis points (0.09%), but comparing any specific point in time may see a wider difference when short-term rates are increasing or decreasing quickly. Over the three years from March 2020 to March 2023, this gap as been as wide as 1.53% in favor of SOFR before the Fed began increasing rates, but as much as 1.12% in favor of the MTA as the federal funds rate approaches its likely peak rate for this cycle.
All in all, one index isn't "better" than any other. All move up and down with what's happening in the economy, with inflation and with monetary policy. Add typical margins onto each, and you'll likely find that the fully-indexed rate for any of them will be pretty well in line with whatever fixed-rate mortgage are at the time... or soon will be. The benefit of an ARM, of course, is that while your rate may go up, it may also go down, and you're not stuck with the rate you got when you obtained your loan.
To see some of the values which make up the chart, click here for the MTA and here for the HSH-calculated monthly 30-day SOFR rates.
If you're considering an ARM, there is a lot more to know and understand than what we've discussed here. Before you start to shop, you'll want to have a read though our Comprehensive Guide to Adjustable Rate Mortgages.
Click here for current and historical values of many of today's most widely-used Adjustable Rate Mortgage Indexes.