
Shifting Balance Of Risks
Update: "Income You Need to Buy a Home in the Top 50 Metros" at HSH.com
August 22, 2025 -- Financial markets seemed to get what they wanted on Friday, when a speech at an economic symposium by Federal Reserve Chair Jay Powell appeared to lay the groundwork for a cut in rates by the Fed next month. Mr. Powell's speech was on "Monetary Policy and the Fed’s Framework Review", but it was the monetary policy portion which was the focus of investors. In the speech, Mr. Powell noted that "inflation, though still somewhat elevated, has come down a great deal from its post-pandemic highs. At the same time, the balance of risks appears to be shifting."
It is the shifting of those risks -- from one focused on inflation trends to one more concerned about softening labor market conditions -- that gives the Fed at least a little room to trim interest rates in the near future, and perhaps multiple times over the remainder of the year.
Said Mr. Powell: "Overall, while the labor market appears to be in balance, it is a curious kind of balance that results from a marked slowing in both the supply of and demand for workers. This unusual situation suggests that downside risks to employment are rising. And if those risks materialize, they can do so quickly in the form of sharply higher layoffs and rising unemployment."
The Fed is trying to navigate a difficult stretch, and at this stage may accept a touch more inflation if it means that an unwanted downturn in labor conditions can be avoided. The haphazard way that tariffs have been an will be implemented -- and the unknowable distribution of those costs among producers, intermediaries and consumer -- makes setting monetary policy tricky.

Mr. Powell noted this: "In the near term, risks to inflation are tilted to the upside, and risks to employment to the downside - a challenging situation." That said, he noted that "A reasonable base case is that the effects will be relatively short lived - a one-time shift in the price level. Of course, "one-time" does not mean "all at once." It will continue to take time for tariff increases to work their way through supply chains and distribution networks. Moreover, tariff rates continue to evolve, potentially prolonging the adjustment process." Provided this is the case, and not a situation where long-term inflation expectations become unmoored from where they seem to be, the Fed may have a little space to gradually trim rates.
After reiterating his position that the Fed's policy rate is "modestly" restrictive, he later went on to comment that "with policy in restrictive territory, the baseline outlook and the shifting balance of risks may warrant adjusting our policy stance." A "modestly" restrictive stance suggests that Fed policy is not very far from neutral, where the base cost of money doesn't retard or enhance economic growth. As such, so there may not be an extended string of cuts in rates to be expected, provided labor conditions don't rapidly deteriorate.
Mr. Powell's comments today may have paved the way for a rate cut next month. The open questions is how large of a cut may come. A quarter-percentage point reduction seems all but assured, but could a larger cut be in the offing, as was the surprise last September? Possibly; much depends upon incoming data over the next three weeks or so, most specifically, the PCE inflation data for July (next Friday), employment report for August (09/05), annual revision to employment data (Sept. 9) and August Producer and Consumer Price data (September 10 and 11, respectively). Until these data come out, and at least for now "the stability of the unemployment rate and other labor market measures allows us to proceed carefully as we consider changes to our policy stance," per Mr. Powell.
Want to get MarketTrends as soon as it's published on Friday? Get it via email -- subscribe here!
After the July jobs report and revisions to May and June data were considerably weaker than had been expected, most voting members of the FOMC won't need much convincing to support a quarter-point reduction in rates. Some may already be developing a preference for a half-point cut, inasmuch as two members supported a 25 basis point reduction in July, and that before the jobs data was released. The Fed of course did not make a move at the July meeting, and the minutes noted that "A majority of participants judged the upside risk to inflation as the greater of these two risks, while several participants viewed the two risks as roughly balanced, and a couple of participants considered downside risk to employment the more salient risk."
The minutes described the conundrum facing the central bank. "Participants generally agreed that the upside risk to inflation and the downside risk to employment remained elevated" noting that "if this year's higher tariffs were to generate a larger-than-expected or a more-persistent-than-anticipated increase in inflation [...] then it would be appropriate to maintain a more restrictive stance of monetary policy," [...] "especially if labor market conditions remained solid. By contrast, if labor market conditions were to weaken materially or if inflation were to come down further and inflation expectations remained well anchored, then it would be appropriate to establish a less restrictive stance."
Data that revealed those weaker labor conditions came after this discussion took place. The minutes noted that "almost all members agreed to maintain the target range for the federal funds rate at 4-1/4 to 4-1/2 percent. A couple of members preferred to lower the target range for the federal funds rate by 25 basis points at this meeting." It's a reasonable bet that a few more would have joined the "couple of members" if the jobs data was released before the meeting started.
Find these only at HSH.com!
As the Fed's monetary policy actions don't specifically determine what happens with market-based mortgage rates, it's likely that they will only move down somewhat, and only then in response to the Fed's acknowledgement of economic conditions hat may be trending in the wrong direction. If you'll recall, a similar worry last year about weakening labor conditions prompted the Fed to cut rates a half-point in September... and mortgage rates began moving higher again as the Fed started to take steps to address that perceived weakness. However, even slightly lower mortgage rates would provide important support to the housing market this fall.
Housing starts perked up in July, rising by 5.2% to a 1.428 million (annualized) pace of construction. Construction of single-family homes picked up by 2.8% to a 913,000 annualized pace, while multi-family construction rose by 9.9% to a 489,000 clip. Permits for future building didn't follow along, as builders have been fairly pessimistic about conditions for a time now. Permits declined by 2.8% overall, with expected single-family construction down by 0.5% to 870,000 while permits for the more volatile multifamily segment slumped 8.2% for the month.
As noted, members of the National Association of Home Builders continue to hold dour attitudes regarding business conditions. The trade group's Housing Market Index for August stepped down a point, landing at 32, back to the bleak level it was two months ago, and sales of single-family homes also shed a point to return to a weak 35 for the month. However, there was slightly more buyer interest in August, as the measure of traffic at sales offices and model homes rose two points to 22, still a very low number but at least a step above July's more than three-and-a-half-year low. Expectations for future sales conditions came in at an unchanged 43; still soggy, but only somewhat. The HMI uses a breakeven value of 50 as a dividing line between better conditions and worse.
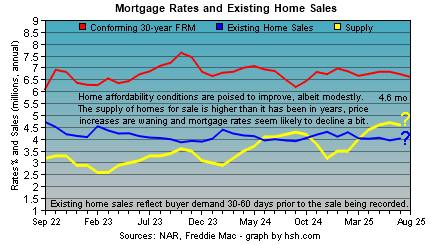
Existing home sales managed a modest improvement in July, and rose by 2% despite ongoing adverse home affordability conditions. Things may be starting to change more meaningfully, though. For the month, sales came in at a 4.01 million pace, an improvement on June's 3.93 million but in reality just about the same rate sales have been at since March. That said, inventories of homes available to buy remained at a fairly high level of 4.6 months of supply at the present rate of sale, and over the last few months inventories have been as "thick" as they have been in perhaps 10 years. At the same time, the long string of outsized price increases seems to be fading out, with July's $422,400 median sales price just 0.2% above the same month last year. It was the smallest year-over-year increase in two years.
We discuss in more detail the change in housing conditions we are seeing in the analysis portion of our updated "Income you need to purchase a home in the top 50 metros".
|
One thing that stood out to us in the existing home sales report for July was the significant monthly step-down in median home price. After setting a new record high of $432,700 just a month ago, the 2.4% drop to $422,400 in July seemed like a larger-than-usual decline, and it was. Looking back over the past 10 June-July periods, the median home price drop this year was the largest since 2022. Over the last 10 such periods, the typical decline as the second quarter turned to the third was 1.7%, and this includes a pandemic-distorted gain of 3.7% when market activity was shifted forward after the spring shutdown.
Of the 10 periods we reviewed, the most meaningful June-July decline was 3.5% in 2022, but you'd likely find that to be unsurprising if we told you that mortgage rates were in the process of moving from 3.22% at the start of the year to 5.78% by mid-June, crushing demand. Over that period, existing home sales retreated from a 6.49 million annual pace to just a 4.81 million rate, a 26% decline. Of course, a 250-basis point increase in 30-year fixed rates will tend to do that and left sellers scrambling to attract buyers and get deals done.
See today's mortgage rates every day at HSH.com
Does mortgage history repeat? Usually. Find out what happened last week/month/year with MarketTrends archives!
This is a bit of a long way around to say that we think there will be larger seasonal price declines than normal this year, as more inventory on the market and only marginally lower mortgage rates continue to press sellers into accepting perhaps a little less than they hoped to get in order to get a transaction completed. We'll see how the coming months roll out in this regard, and will be updating our Home Value Tracker for the second quarter next week to see if a growing number of housing markets are seeing price declines.
Manufacturing conditions continue to be uneven at best. We learned last week that factory activity picked up in the district served by the Federal Reserve Bank of New York; this week, a local update for August from the region covered by the Federal Reserve Bank of Philadelphia told a different story. The local manufacturing gauge for this area slumped 16.2 points, falling from +15.9 to -0.3 for this month; new orders retreated somewhat more, dropping by 20.3 points to land at -1.9 for August. Employment conditions remained fair, but a little less so, with this component registering 5.9, a softening from July's 10.3 value. Not softening at all, and in fact rising to its highest mark in more than three years was the "prices paid" measure, rising eight points to 66.8 in the latest month.
Requests for mortgage credit settled back in the week of August 15, according to the Mortgage Bankers Association. The 1.4% decline was the result of purchase-money mortgage applications easing by just 0.1%, leaving the 3.1% decline in requests for funds to refinance existing loans the reason for the overall dip. Headlines generated by the Mr. Powell's allusion to lower rates ahead will likely generate some homebuyer and homeowner interest in mortgages in the coming weeks.
Concerns regarding labor market conditions have focused around the tepid pace of hiring over the last few months. While not hiring at a brisk pace, businesses are also not letting folks go at a concerning rate either. As well, it's up for debate exactly many new hires are needed to keep the unemployment rate at its current low level given the effects on immigration policy on the size of the workforce. Regardless, the 235,000 new applications for unemployment benefits in the week ending August 16 was an uptick of 11,000 from the prior week and the highest number since last June. That said, first-time claims still remain at a low level, which is not something you can say for continuing claims. The ranks of those receiving ongoing support rose by 30,000 in the latest week, and at 1.972 million it is the greatest number since November 2021. If anything, it is this durable unemployment that should be of most concern to the Fed, at least right now.
Current Adjustable Rate Mortgage (ARM) Indexes
| Index | For The Week Ending | Year Ago | |
|---|---|---|---|
| Aug 15 | Jul 18 | Aug 16 | |
| 6-Mo. TCM | 4.12% | 4.31% | 5.01% |
| 1-Yr. TCM | 3.91% | 4.09% | 4.46% |
| 3-Yr. TCM | 3.69% | 3.88% | 3.82% |
| 10-Yr. TCM | 4.28% | 4.46% | 3.88% |
| Federal Cost of Funds |
3.694% | 3.677% | 4.003% |
| 30-day SOFR (daily value) | 4.33635% | 4.33962% | 5.34982% |
| Moving Treasury Average (MTA/12-MAT) |
4.153% | 4.221% | 5.123% |
| Freddie Mac 30-yr FRM |
6.63% | 6.77% | 6.49% |
| Historical ARM Index Data | |||
The economy looks to be performing okay through the second quarter so far, and the GDPNow model from the Federal Reserve Bank of Atlanta points to a 2.3% running rate through August 19. The FRB/NY's Nowcast model is in pretty good agreement, pegging growth at a 2.01% rate through August 22. The same can't be said for the outlook suggested by the Conference Board's index of Leading Economic Indicators as the LEI posted a -0.1% value for July. Outside of two unchanged months and a single positive one last November, the LEI has posted a nearly-unbroken string of negative monthly values since March 2022. While it doesn't appear that a recession is imminent, the LEI does continue to suggest that sluggish economic growth is to be expected ahead. Of course, its been forecasting that for at least a couple of years now despite mostly solid growth over that time.
The risks in the economic climate may be shifting, but lets hope they only shift gradually, with inflation only mildly and temporarily rising -- "transitory", if you will -- and that labor conditions only gently loosen from here. The Fed's most recent SEP forecast expects a modest rise in unemployment to a 4.5% rate by the end of this year and holding there next year and core inflation to hit 3.1% by December before retreating through 2026. Less of both of these would be better, and would likely allow the Fed to gently lower rates as we go along. Stability has its merits, as we saw in the record-long expansion that the pandemic prematurely ended.
As the business and inflation climate over the last few months has been confusing and uncertain, there's nothing that investors want to see more than a bit of clarity or certainty somewhere. While it certainly is not a guarantee, Fed Chair Powell's allusion to a coming change in policy was clear enough, lifting equity markets to a big rally on Friday and even sparking a bit of a rally in bonds. This sent the influential yield on the 10-year Treasury down by about seven basis points, changing what was shaping up to be a choppy but essentially unchanged week into one that points to a decline in mortgage rates for next week. With this backdrop, we expect to see a modest decline of two to five basis points in the average offered rate for a conforming 30-year fixed-rate mortgage as reported by Freddie Mac next Thursday, but it could be a bit more if there's some follow-through or carry over from Friday's bond market rally.
Spring has given way to the lazy days of summer, but what's the outlook for mortgage rates between now and September? Check out our latest Two-Month Forecast for mortgage rates covering July and August. We'll be working on one to cover the end of summer and early fall next week.
See our 2025 Mortgage and Housing Market Outlook, covering mortgage rates, housing conditions, the Fed and lots more. We recently did a mid-year review of our expectations to see how things are shaping up.
Also, for a really long-run outlook, you'll want to review "Federal Reserve Policy and Mortgage Rate Cycles".
Have you seen HSH in the news lately?
Want to comment on this Market Trends? -- send your feedback, argue with us, or just tell us what you think.
See what's happening at HSH.com -- get the latest news, advice and more! Follow us on Twitter/X.
For further Information, inquiries, or comment: Keith T. Gumbinger, Vice President
Copyright 2025, HSH® Associates, Financial Publishers. All rights reserved.